AOSHIMA LABORATORY
Leading the world in new research in statistics
for High-Dimensional Data Analysis

ABOUT OUR RESEARCH
In our laboratory, our current interests are in the field of high-dimensional data such as genetic microarrays, medical imaging, text recognition, finance, chemometrics, and so on. A common feature of high-dimensional data is that the data dimension is high, however, the sample size is relatively low. This is the so-called "high-dimension, low-sample-size (HDLSS)" or "large p, small n" data situation: here p is the data dimension and n is the sample size. For example, microarrays for measuring gene expression levels are one of the currently active areas of data analysis. A single measurement yields simultaneous expression levels for thousands to tens of thousands of genes. The sizes of most data sets are in the tens, or maybe low hundreds, and so the dimension p of the data vector is much larger than the sample size n.
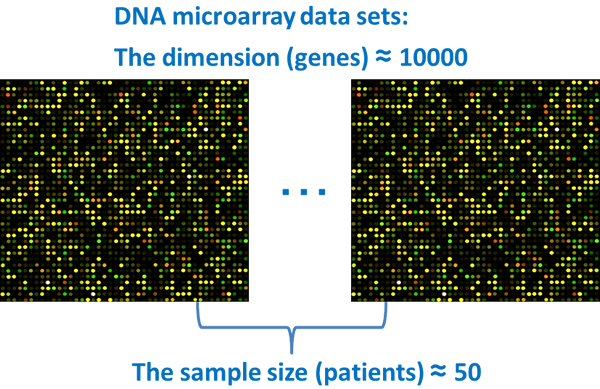
For such data sets, one cannot apply the conventional multivariate statistical analysis that is based on the large sample asymptotic theory in which n→∞ while p is fixed. The most challenging issue is to develop new asymptotic theories and methodologies for high-dimensional data analysis in the context of n/p→0 and p→∞. One of our goals is to provide statistical analysis tools for high-dimensional data analysis, and for which high accuracy can be proved. Proof of high accuracy is unique in the field of high-dimensional data analysis, as is our use of geometrics, placing our laboratory on the cutting edge of modern science in the world.
Our main contributions to the field of high-dimensional data analysis are:
(1) Geometric Representations of HDLSS Data in a Dual Space
A key of statistical inference on high-dimensional data is to find geometric representations of HDLSS data in a dual space. In Yata and Aoshima (2012), we proved that HDLSS data sets have completely different geometric representations depending on whether the data are of Gaussian type or not. By using the geometric representations, we created a variety of effective methodologies for high-dimensional data analysis.
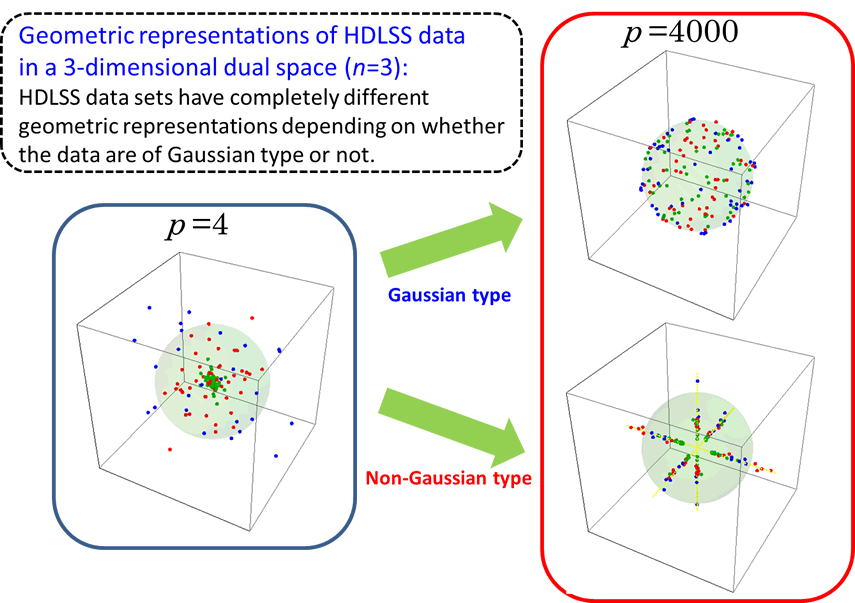
Fig. 1. Geometric representations of HDLSS data in a dual space (when n=3)
as p increases.
See Yata and Aoshima (2012) for the details.
(2) Effective Classification for High-Dimensional Data
In Aoshima and Yata (2011a,b), we developed a variety of high-dimensional statistical inference such as a given-bandwidth confidence region, a two-sample test, a test of equality of two covariance matrices, classification, regression, variable selection, pathway analysis and so on, along with sample size determination to ensure prespecified accuracy for each inference. As for classification, we created a discriminant rule called the misclassification rate adjusted classifier that can ensure accuracy in misclassification rates for multiclass, high-dimensional classification. The classifier can draw out rich information on high-dimensional classification by using the heteroscedasticity that grows as p increases. We proved that the classifier can ensure high accuracy in misclassification rates when the dimension is high.
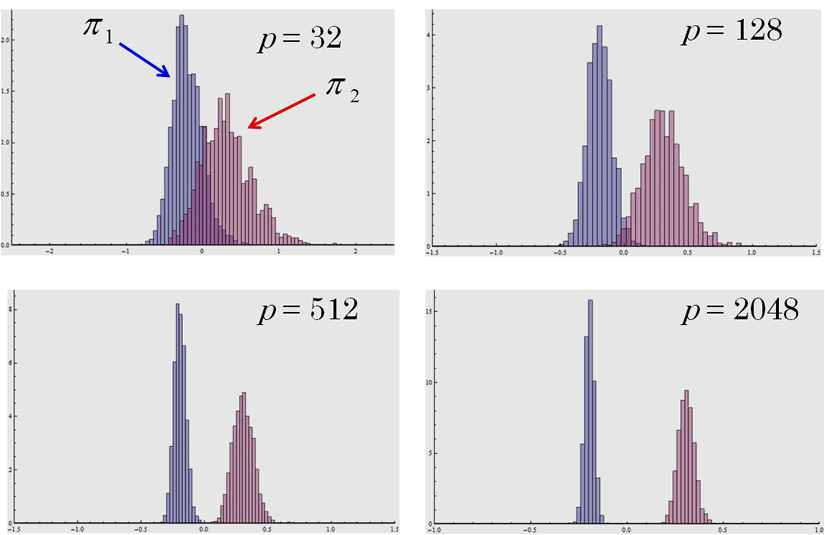
Fig. 2. The histograms of the classifier (n1=n2=10) when the individual belongs to π1: Np(0, Ip) or π2: Np(0, 2Ip). The histograms are mutually separated as p increases. Even though the two classes have a common mean vector, the classifier can classify the individual perfectly when the dimension is high. See Aoshima and Yata (2011) for the details.
(3) Effective PCA for High-Dimensional Data
In Yata and Aoshima (2009), we first clarified the limit of the conventional principal component analysis (PCA) for high-dimensional data. We showed that the estimator of eigenvalues in the conventional PCA is affected by the noise structure, directly, so that the estimator becomes inconsistent for high-dimensional data. In order to overcome the curse of dimensionality, we developed new PCAs called the noise-reduction (NR) methodology and the cross-data-matrix (CDM) methodology in Yata and Aoshima (2010, 2012). We proved that the new PCAs can enjoy consistency properties on estimation not only for eigenvalues but also for PC directions and PC scores in high-dimensional data analysis.
We applied the new PCAs to cluster analysis. We gave an example by using prostate cancer data in Pochet et al. (2004, Bioinformatics). The data set consisted of p=12600 genes and n=34 patients. Our goal was to classify each individual into normal group and tumor group. In Fig. 3, we plotted the first and second PC scores of the 34 individuals by using the conventional PCA (left panel) and the CDM method (right panel). We proposed to classify them according to plus and minus of the first PC score. From a real-life medical check, the normal group was denoted by ● and the tumor group was denoted by ●.
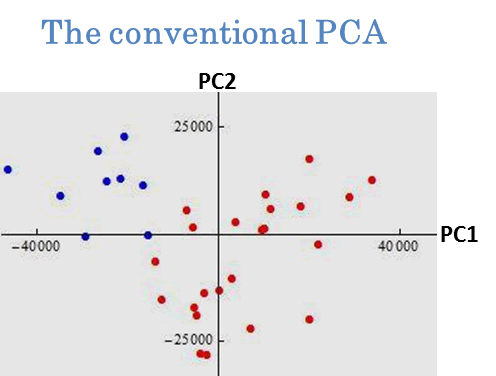
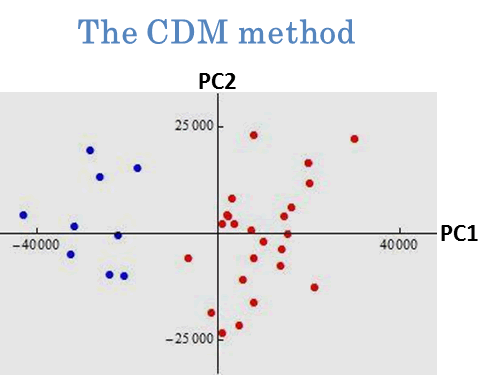
Fig. 3. Clustering by PCAs. The 34 individuals were classified by plus and minus of the first PC score. After a slight modification, the conventional PCA mislabeled eleven individuals and the CDM method mislabeled only one individual. See Yata and Aoshima (2010) for the details.
(4) Sample Size Determination to Ensure High Accuracy on High-Dimensional Inference
In Aoshima and Yata (2011a,b, 2013a,b), we developed a variety of inference on high-dimensional data such as a given-bandwidth confidence region, a two-sample test, a test of equality of two covariance matrices, classification, regression, variable selection, pathway analysis and so on. They provided sample size determination to ensure prespecified accuracy for each inference. Aoshima and Yata (2011a) was the first attempt to applying sequential analysis to high-dimensional statistical inference. In Yata and Aoshima (2013), we developed the ideas given by Aoshima and Yata (2011a) and created a new estimation method called the extended cross-data-matrix (ECDM) methodology. The ECDM method offers an optimal unbiased estimator on the basis of Vn(1)(k) and Vn(2)(k) by
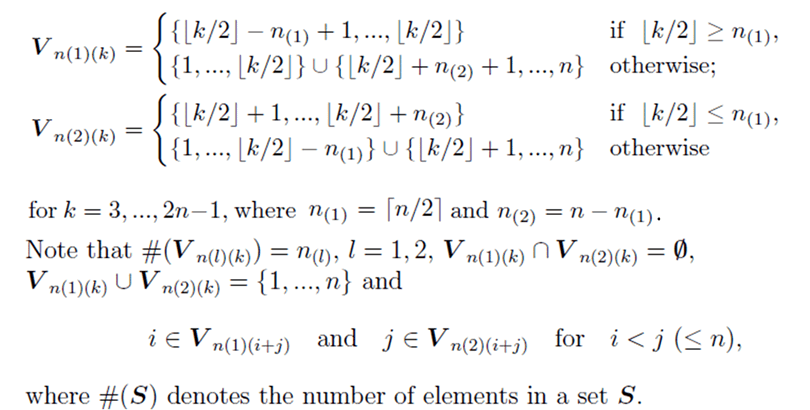
The ECDM method considers all the combinations of cross data matrices so as to construct an optimal unbiased estimator for parameters appearing in high-dimensional data analysis. We proved that the ECDM method holds desirable properties on estimation even when data is of non-Gaussian type. In addition, the computational cost of the ECDM method is lower than the other existing methods.
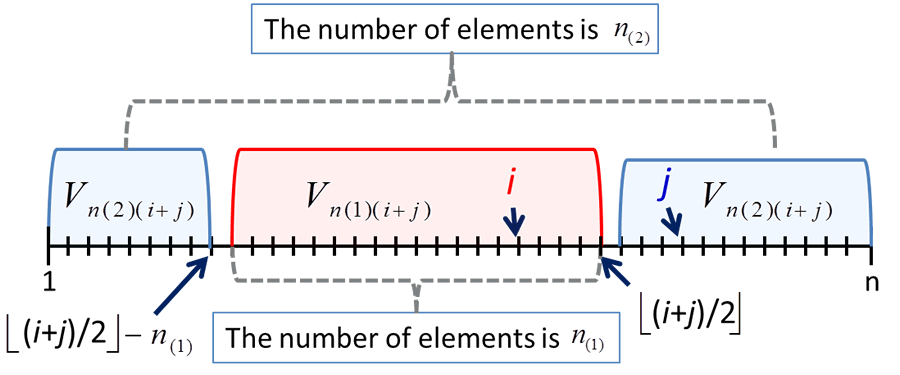
Fig. 4. The image of Vn(1)(i+j) and Vn(2)(i+j) when ⌊(i+j)/2⌋ ≥ n1.
REFERENCES:
- [1]
- Aoshima, M. and Yata, K. (2011a): [Editor's special invited paper] Sequential
Anal. 30, 356-399.
[This paper was awarded the Abraham Wald Prize in Sequential Analysis 2012.] - [2]
- Aoshima, M. and Yata, K. (2011b): [Authors' Response] Sequential Anal. 30, 432-440.
- [3]
- Aoshima, M. and Yata, K. (2013a): [Invited Review Article] Sugaku 65, 225-247
(in Japanese). - [4]
- Aoshima, M. and Yata, K. (2013b): [The Japan Statistical Society Research Prize Lecture] J. Japan Statist. Soc. Ser. J 43, 123-150 (in Japanese).
- [5]
- Yata, K. and Aoshima, M. (2009): Comm. Statist. Theory Methods 38 [Special issue honoring S. Zacks], 2634-2652.
- [6]
- Yata, K. and Aoshima, M. (2010): J. Multivariate Anal. 101, 2060-2077.
- [7]
- Yata, K. and Aoshima, M. (2012): J. Multivariate Anal. 105, 193-215.
- [8]
- Yata, K. and Aoshima, M. (2013): J. Multivariate Anal. 117, 313-331.